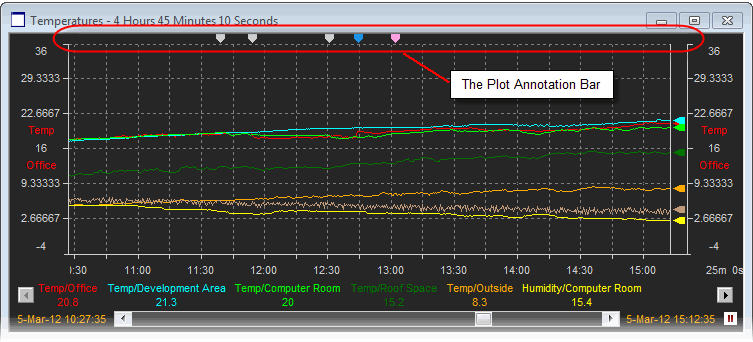
The area above the graph region in a plot window is known as the 'Annotation Bar'. If the current plot is connected to an SDR which has Annotations for the selected time period, then tick marks will be shown in the Annotation Bar to represent each of the Annotations.

When viewing a plot, the time periods for which annotations exist are identified by small 'tick' marks that appear across the top of the plot.
Tip: If Annotation Tick Marks are not visible within the Plot Annotation Bar it may be because the Show Annotations User Preference has not been set.
Two types of Annotations are displayed within the Plot Annotation bar, these are:
Annotations that are associated with an item that is mapped to a pen within the current plot. These are shown in the color of the associated pen.
Global Annotations (i.e. Annotations which are not associated with a specific pen). These are shown in Gray.
Note: Should Annotations exist which are not associated with any of the pens within the active plot, then no tick mark will be present.
If the plot cursor has been turned on and is being used to traverse the plot, any graph annotation whose time matches that of the cursor will turn the same color as the cursor when the cursor 'passes' across the annotation.
Note: For X-Y and Radar plots, the width of the plot window is still used to represent the time period for the plot, even though the graphs do not implicitly have a time axis.

Annotations can be viewed by placing the cursor on top of the annotation marker which will display the annotation as a tool-tip (see above) or via the Annotation Browser.
Note: Annotations will not be displayed unless the user has checked the Show Annotations checkbox on the User Preferences dialog.
|
Right-clicking on an Annotation will launch the Zoom To menu.
This allows the user to focus in on the time period when the Annotation was logged for analysis purposes.
Note: This feature can also be accessed directly via the Plot Annotation Browser. Tip: Once complete, use the right-click "Back" menu option to revert to the original plot duration. |
|