Release V6-2 is the latest version of SapphireTrend, Jemmac Software’s world leading real-time process visualization package.
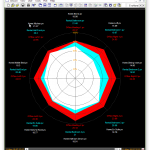
Headline features include the new Radar Area Chart graph style which allows multiple polygons to be drawn within a single radar plot.
The Collector also has a new Script based Plug-in DLL which allows data from virtually any third party application to be historized and trended within Sapphire.
Various usability improvements have been made to stPro allow group and linked pen scales to be set up more quickly and to aid pen ordering changes. The Plot Data Viewer in available in stOCX for the first time and has been enhanced to show 1 min, 6 min, hourly and daily averages in addition to the existing spot values.
Radar Area Charts
Traditional Radar plots in stPro distribute the pens evenly round a single polygon, with options to alarm based on minimum and maximum target values.
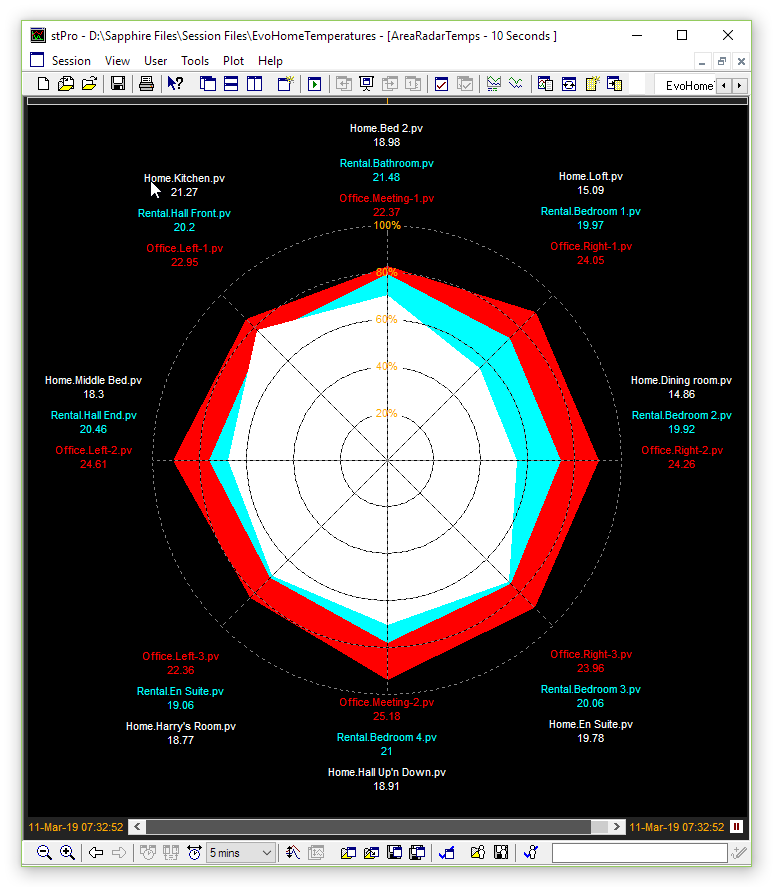
The new Radar Area Charts allow the user to determine the number of radials to display on the radar, so if a plot has twelve pens and the user selected to display six radials, then two polygons will be displayed.
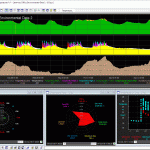
In the screen shot there are twenty four pens set to display eight radials (i.e. pens) per polygon, resulting in three polygons being displayed.
Radar Area Charts provide an excellent way to compare multiple data sets of like data.
In the example the three polygons display temperatures in three separate buildings. The red Polygon in an office, the white polygon is a domestic property and the cyan is a rental property.
The scales are set identically for all the pens in the plot via the Link to Pen option allowing one pens scales to control the scales of the other twenty three pens. In this case the scales are set to a range of 0 to 27 Deg C via Pen 1 – the red pen at 12 o-clock.
As can be seen, the office (the red polygon) has the highest over temperature. It is relatively uniform in shape indicating an even spread of temperature throughout the building, but “Meeting-1” which is 12 0’clock is noticeably colder.
In comparison “Meeting-2” is the warmest area at 25.18 Deg C. The combination of these means the red Polygon is vertically biased towards the bottom of the plot.
There is a much wide range of temperatures for the domestic residence ‘home’ (the white polygon). The Kitchen is the warmest room reporting a temperature of 21.27 Dec C. This is illustrated by the ‘deflection’ in the top-left quadrant. In comparison, the Dining room is the coldest room at just 14.86 Deg C. This can be seen by the reduced area on the radial at 3 o-clock.
The Radar Area Chart makes it simple to compare the relative temperatures across each of the properties, whilst also allowing the range of temperature in each building to be quickly understood.
Data Viewer Averages
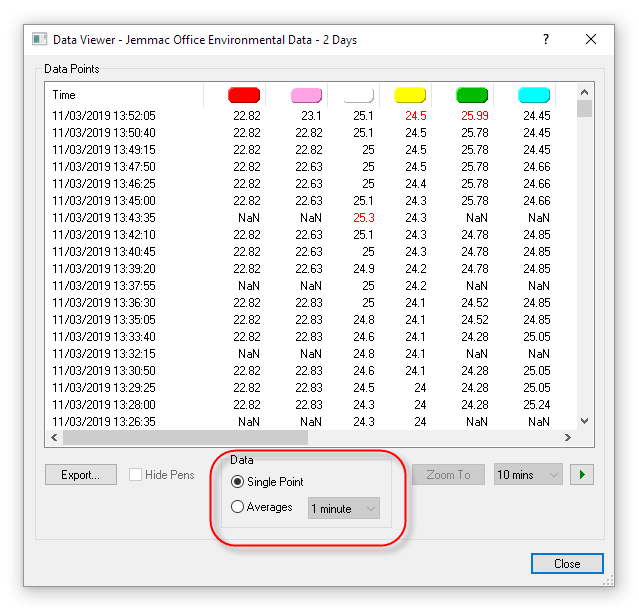
The Data Viewer provides a tabular representation of the data with a plot, allowing the user to quickly sort the values to find the minimum and maximum values within a plot. It also allows the plot cursor to be driven by value sequence rather than time ordering making it easy to traverse the peaks for items on the plots.
For release V6-2 a feature was added allowing the user to choose to see a range of averages in the Data Viewer instead of just the ‘spot’ value used in the trend.
stPro Enhancements
A range of enhancements have been made to stPro to improve its usability:
Right-click pen scales – The scale mode of pens can now be set via the Item Details Area right-click menus allowing pens scales to be linked quickly without using the Plot Properties dialog.
Plot Level Fit to Scale – The option to re-calculate the Scale of pens in Auto Scale mode has now been made a plot preference allowing different trends to have different behavioural settings.
Grid Time Snap – The logic used to snap the grid lines to time periods has been improved so that the vertical lines snap to day/hour/minute boundaries more consistently
Vertical Grid Spacing – The spacing between the vertical plot grid lines can now be adjusted on a per plot basis via the new Y-axis Grid control on the Plot Properties Preferences tab.
Improved Time Labelling – The Time axis labelling has been improved for strip charts to make it easier to pick out day boundaries, the start of months etc.
The __Script__ Plug-in Dll
The Sapphire Collector supports a range of standard Plug-ins allowing a wealth of data to be collected and historized beyond traditional OPC.
- SNMP – The Simple Network Management Protocol plug-in allows values from network devices such as servers, printers, hubs, switches and routers to be collected.
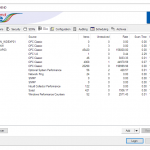
- WinPerf – The Windows Performance Counter plug-in allows operating system, application, service or driver performance data to be collected. This can be very useful for analysing resources leaks (memory, handles or threads for example) in troublesome applications or software.
- Ping – The Network performance Ping plug-in allows the average, max, min ping times, plus the Time To Live (TTL) and percentage packet loss for network end points to be historized.
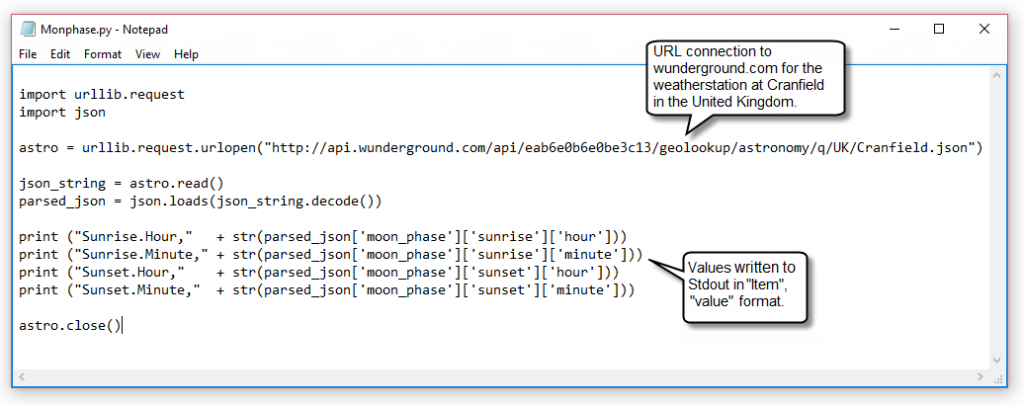
For release V6-2. a new plug-in has been added to allow scripts to be scheduled for execution by the Sapphire Collector, with the output from the script then historized by the Collector. The only requirement is that the output from the script is in “Item”, “Value” format.
One example use would be to execute a Python script to query a specific weather station via HTTP/JSON requests. Similar API’s exist for a variety of data, from Stock and Shares to Environmental data. If it can be queried, it can be historized in Sapphire!
Example output format (in this instance Financial data):
- FTSE.Price,7412.01
FTSE.Change,+33.62
FTSE.Open,7378.39
FTSE250.Price,19511.82
FTSE250.Change,+103.46
FTSE250.Open,19408.36
Importing CSV Data – In addition to a executing scripts the __Script__ plug-in can also execute MS-DOS batch files. A very simple use for this is to import CSV files generated by third party applications into Sapphire by simply ‘Typing’ the file, thereby sending its contents to std out so the data can be imported into the Collector.
Example MS-DOS Batch file “DumpCSV.bat”:
- @echo off
type “\\CRAN01ZZSMS04\Exports\1MinData.CSV”
The bat file is then configured to be regularly executed via the __Script__ configuration file:
- [WWN]
Script=”D:\MyCSV\DumpCSV.bat”
DeadBandSecs=10
LogOutput=1
TurnMissingItemsOffline=0
Offset=00:03:00
For more details about SapphireTrend, see the Product page for it.
