Overview
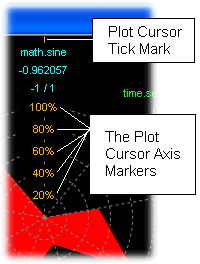
For Radar Plots the Plot Cursor does not appear as a visible marker on the plot. Instead the scales on the vertical axis change color to indicate that the Plot Cursor is active.
Tip: Even though Radar Plots do not have a time axis it is still possible to gauge the time position of the cursor via the Plot Cursor Tick Mark which will be displayed in the Annotation Bar when the Plot Cursor is enabled.
Zooming with the Plot Cursor
Note: It is not possible to zoom using the Plot Cursor for Radar Plots.
