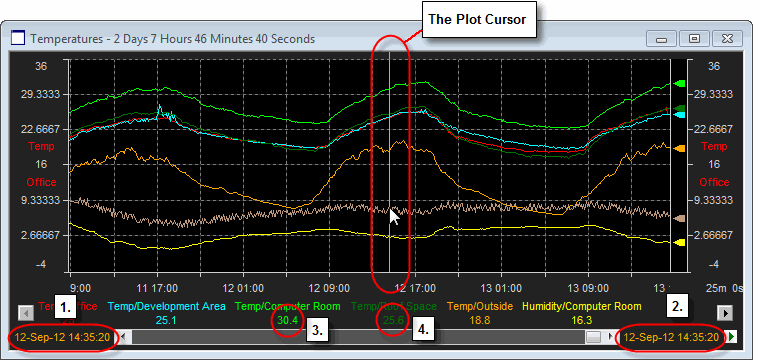
The operation of Plot Cursor is dependant upon the Graph Style chosen for the plot. However, there are some common behavioral characteristics for all the Graph Styles. These are covered in the following sections with sub-sections detailing the style specific operations.
Enabling the Plot Cursor
To enable the Plot Cursor, left-click on the Graph region within the required plot. A second left-click will disable the Plot Cursor.
Once the Plot Cursor in enabled a visual confirmation will the be shown to indicate that the plot cursor is active - this takes a different form depending upon the chosen Graph Style:
Strip Charts - a solid vertical line will be displayed on the plot.
X-Y Graphs - the appropriate data pairs will be circled.
Radar Plots - The vertical scale values will change color.
Note: In addition, a visual marker called the Plot Cursor Tick will appear in the Annotation Bar indicating the position of the Plot Cursor relative to time period of the plot.

Once enabled, the time indicators for the plot will show the time slice for the cursor (1. and 2.) and the item details area will show the values for each item at that specific point in time (3. and 4. etc).
Note: If the mouse is positioned over the main graph region the plot cursor will be displayed at the most recent time slice. To enable the plot cursor on a specific time period move the mouse to the required position in the Annotation Bar and then click to enable the cursor.
Tip: The colour of the Plot Cursor can be changed via the User Preferences Dialog.
Panning with the Plot Cursor
Once enabled the Plot Cursor can be moved to display data from any time period within the current plot.
Small Adjustments - When minor adjustments to the position of the Plot Cursor are required, it can be difficult to get the level of control required via a mouse. To make fine adjustment easier, the Left and Right Cursor Keys can be used to adjust the position of the cursor in single increments.
Large Adjustments - To make larger adjustments to the location of the Plot Cursor, position the mouse over the Annotation Bar and 'sweep' the cursor to the required location.