Overview
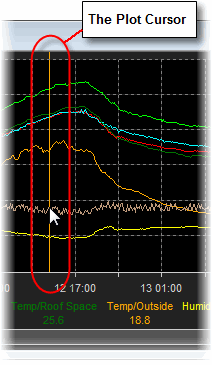
For Strip Charts the Plot Cursor is a solid vertical line which appears on the Active Plot whenever the mouse pointer is within the plot borders and the left mouse button is clicked.
Once activated, the user can sweep the Plot Cursor across the plot allowing the values for different comb points to be views in the Item Details Area under the plot.
Single left clicking the mouse will turn the Plot Cursor off again.
Note: To aid clarity for strip-charts the Plot Cursor extends into the Annotation Bar forming a single line with the Plot Cursor Tick Mark.

Zooming with the Plot Cursor
Double click the left mouse button twice to define left and right time markers for the required time period. Once the second marker has been set, stPro will automatically zoom in to the desired time period.

Tip: If only a single marker is defined, manually zooming in (Ctrl-I) uses the right hand side of the plot as the second time marker. Similarly manually zooming out (Ctrl-U) uses the left-hand side of the plot as the first time marker.
Calculating the duration of an event
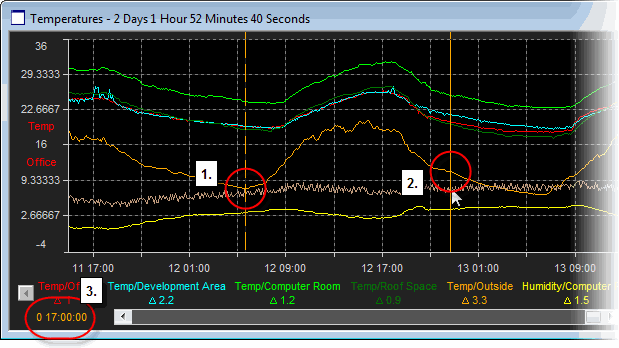
It is often useful to be able to measure the duration of an event or an upset. The Plot cursor provides an easy way of doing this without changing the duration of the plot in view.
To determine the duration of a significant event in a plot, do the following:

Steps:
-
Double left-click to 'mark' the start time of the event.
-
Sweep the cursor to the required end time.
-
Read the duration of the event from the left hand time indicator.
-
Single left-click to clear the cursors when finished.
Measuring Delta values
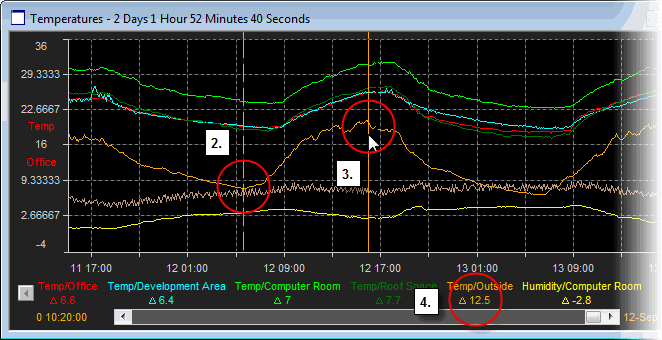
In addition to being able to measure the time between events, it is also possible to measure the delta value between values for a given pen values at two points in time.
To do this, perform the following steps:
-
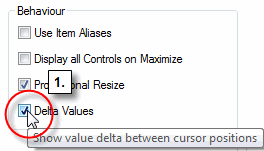
Check the "Delta Values" option in the Behaviour section of the User Preferences dialog.

-
Double left-click to 'mark' the time point for the first value.
-
Sweep the cursor to the required time point for the second value.
-
Read the delta value for the required pen. In the example above there is a delta of 11.3 degrees for the red pen between the two time points marked by the cursors.

-
Single left-click to clear the cursors when finished.
Tip: Delta values are always prefixed with a triangle to help differentiate them from actual data points.