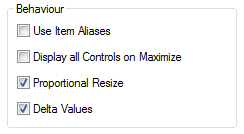
The Behaviour controls can be used to tailor some of the basic characteristics of stPro to your needs..

|
Attribute: |
Default: |
Purpose: |
|
Use Item Aliases |
Disabled |
When enabled the Aliases associated with each OPC item will be displayed in the Pen selection controls and also in the Item Details area under the plot. Note: The item list dialogs contain columns for both the genuine OPC item names and also for the Aliases. These columns are NOT switched via this control allowing the user to enable or disable the columns as required via the normal item list controls. |
|
Display All Controls on Maximize
|
Disabled |
When set, this feature turns all the plot controls back on whenever a plot window is maximized. Tip: This can be especially useful switching from Overview mode to viewing a single plot. |
|
Proportional Resize |
Enabled |
This feature maintains the relative size of each plot window with relation to the overall application window size. Thus as the main application window is resized, the plot windows will also resize to maintain the same proportions with respect to the main window. Tip: This feature is very useful when an overview display consisting of several plot windows has been created since the plots will be stretched or shrunk along with the application window should it be resized. Note: In situations where each plot window is required to be a set size and to remain at that size as the application is resized this feature should be turned off. |
|
Delta Values |
Disabled |
When set, this feature allows the user to measure the delta value between two points in time. The feature is activated by double left clicking on the plot to mark the position of the first time point. The user can then sweep the second cursor to the required position and read off the delta values from the Item Details Area. Note: When this feature is active the values in the Item Details Area are prefixed with a triangle to alert the user that delta values are being displayed. Tip: See the Plot Cursors page for more details on how to measure delta values on a plot. |