Overview
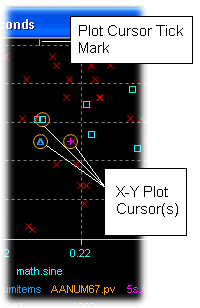
For X-Y Graphs the Plot Cursor is a circle surrounding each data pair for the chosen time slice which appears on the Active Plot whenever the mouse pointer is within the plot borders.
Note: For X-Y Graphs the data points are not displayed relative to time, this panning with the Plot Cursor enabled will cause the cursor to 'jump' between consecutive data pairs rather than traversing the pairs from left to right as is the case for Strip Chars.
Tip: Even though X-Y Graphs are not time based, it is still possible to gauge the time position of the cursor via the Plot Cursor Tick Mark which will be displayed in the Annotation Bar when the Plot Cursor is enabled.
Zooming with the Plot Cursor
Note: It is not possible to zoom using the Plot Cursor for X-Y Graphs.
